How Inflation Is Measured — and Why Your Personal Rate Never Matches the Headline
Every month a headline announces "inflation is X%", and every month it fails to match what you see at the checkout. Both numbers are usually honest — they’re just measuring different baskets. Understanding how the official rate is built explains the gap, and turns inflation from background noise into something you can actually plan around. To see what any rate does to money over time, run it through the inflation calculator.
Open the Inflation Calculator →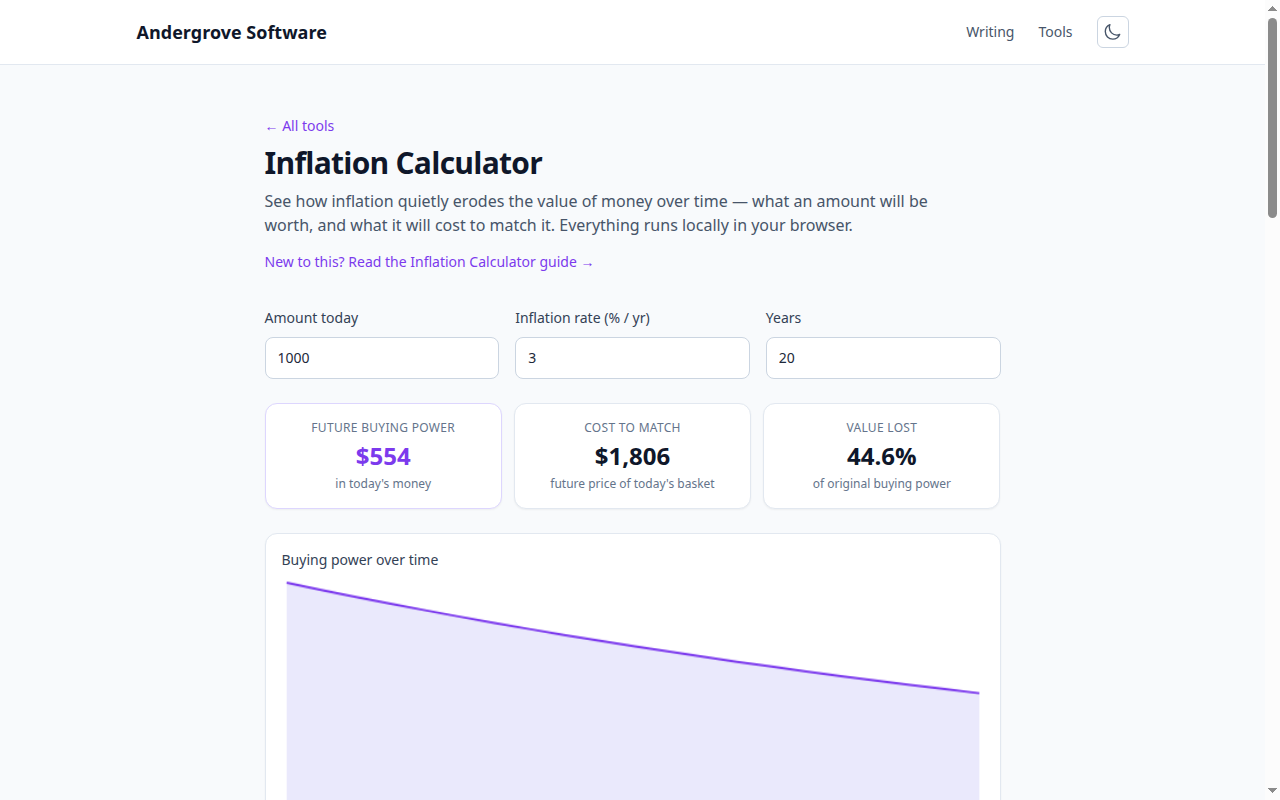
The basket: how the official number is built
Statistical agencies track the prices of a huge fixed-ish basket — hundreds of categories from bread to rent to haircuts — and weight each by its share of average household spending. The consumer price index (CPI) is that weighted total; "inflation" is its change over a year. Two details do most of the explaining later: the weights describe a national average household that nobody actually is, and housing — the biggest weight — is measured in ways that lag live market prices (US statisticians, for instance, estimate what owners would pay to rent their own homes). The number is a careful average, and averages hide everyone in them.
Why your personal rate is different
Your inflation rate is the CPI computed with your weights, and your weights are nothing like average. A renter in a hot city carries a housing weight the index dilutes; a commuter feels fuel spikes triple-strength; a student loaded with rent, food and transport — the categories that spiked hardest in recent years — can run several points above the headline while a homeowner with a fixed mortgage runs below it. There’s a perception layer too: you buy groceries weekly but a sofa once a decade, so frequent purchases dominate your sense of prices — and grocery prices are among the most volatile categories. When the headline says 3% and your gut says 8%, list your five biggest monthly expenses and their price changes: that’s your real answer, and it’s probably in between.
Real vs. nominal: the only two words you need
A nominal number is the sticker; a real number is the sticker after inflation. The distinction quietly decides things people argue about with the wrong numbers: a 4% raise during 5% inflation is a real pay cut; a savings account paying 2% under 3% inflation loses purchasing power every day it "grows"; and a movie’s all-time box-office record set decades apart is meaningless until both figures are put in the same year’s money. The quick mental check is the rule of 72 run in reverse: at 3% inflation, money halves its buying power in about 24 years — which is why every retirement plan that talks in today’s dollars must grow through, not just to, its target (the retirement calculator lets you sanity-check that math).
Using the measure without being used by it
Three practical habits follow. Quote big past-vs-present comparisons in real terms — the calculator converts any amount between years at a rate you choose, including your personal estimate instead of the official one. Negotiate salaries and set prices annually with the current rate in hand; skipping a year silently bakes in a real cut. And for money with a long horizon, compare its growth rate against inflation first — beating zero is easy, beating inflation is the actual assignment, and the difference compounds exactly the way compound interest always does, in whichever direction you’ve arranged.
Ready to try it? Open the Inflation Calculator →